1
2
3
4
5
6
7
8
9
10
11
12
13
14
15
16
17
18
19
20
21
22
23
24
| """
demo_01_fill.py plot里的填充
"""
import numpy as np
import matplotlib.pyplot as plt
x = np.linspace(0, 8*np.pi, 1000)
sinx = np.sin(x)
cosx = np.cos(x/2)/2
plt.figure('Fill', facecolor='lightgray')
plt.title('Fill', fontsize=18)
plt.grid(linestyle=':')
plt.plot(x, sinx, color='dodgerblue',
label='sin(x)')
plt.plot(x, cosx, color='orangered',
label='cos(x)')
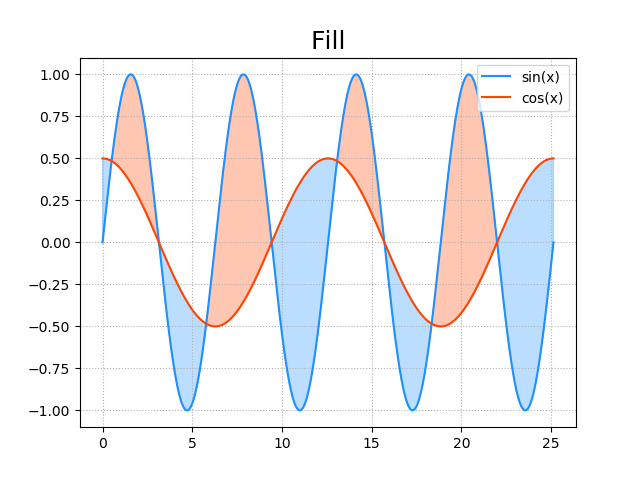
plt.fill_between(x, sinx, cosx, sinx<cosx,
color='dodgerblue', alpha=.3)
plt.fill_between(x, sinx, cosx, sinx>cosx,
color='orangered', alpha=.3)
plt.legend()
plt.savefig('fill_between.png')
plt.show()
|
