1
2
3
4
5
6
7
8
9
10
11
12
13
14
15
16
17
18
19
20
21
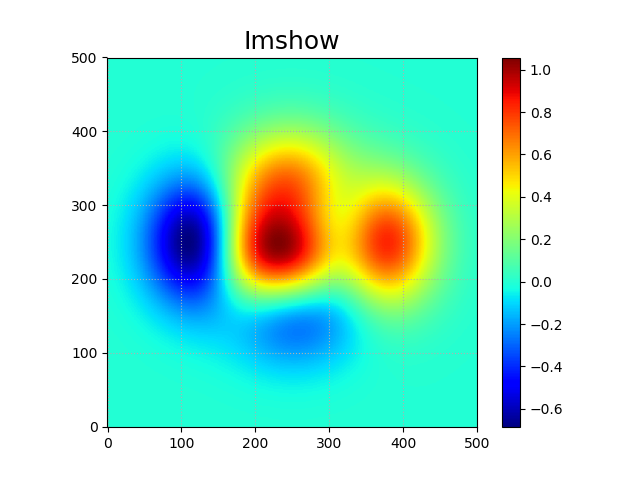
| """
demo04_imshow.py 绘制热成像图
"""
import numpy as np
import matplotlib.pyplot as plt
n = 500
x, y = np.meshgrid(np.linspace(-3, 3, n),
np.linspace(-3, 3, n))
z = (1 - x/2 + x**5 + y**3) * np.exp(-x**2 - y**2)
plt.figure('Imshow', facecolor='lightgray')
plt.title('Imshow', fontsize=18)
plt.grid(linestyle=':')
plt.imshow(z, cmap='jet', origin='lower')
plt.colorbar()
plt.savefig('Imshow.png')
plt.show()
|
