1
2
3
4
5
6
7
8
9
10
11
12
13
14
15
16
17
18
19
20
21
22
23
24
25
26
27
28
29
30
| """
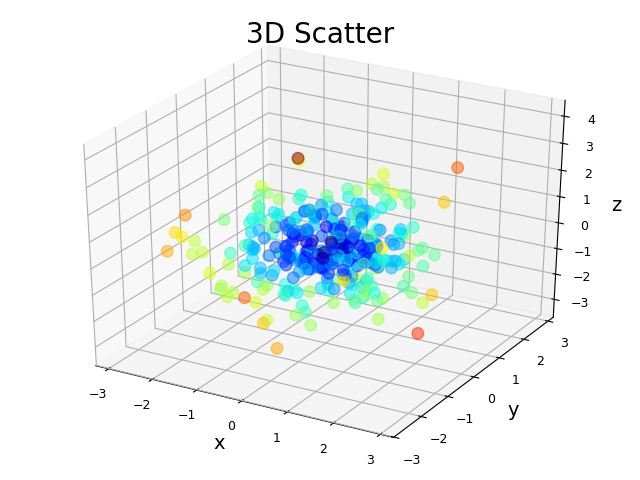
demo06_3dscatter.py 3D图
"""
import numpy as np
import matplotlib.pyplot as plt
from mpl_toolkits.mplot3d import axes3d
n = 300
x = np.random.normal(0, 1, n)
y = np.random.normal(0, 1, n)
z = np.random.normal(0, 1, n)
plt.figure('3D Scatter', facecolor='lightgray')
ax3d = plt.gca(projection='3d')
plt.title('3D Scatter', fontsize=20)
ax3d.set_xlabel('x', fontsize=14)
ax3d.set_ylabel('y', fontsize=14)
ax3d.set_zlabel('z', fontsize=14)
plt.xticks([-3, -2, -1, 0, 1, 2, 3])
plt.yticks([-3, -2, -1, 0, 1, 2, 3])
plt.tick_params(labelsize=9)
d = np.sqrt(x**2 + y**2 + z**2)
ax3d.scatter(x, y, z, marker='o', s=70, c=d,
alpha=.5, cmap='jet')
for spine in ax3d.spines.values():
spine.set_visible(False)
plt.tight_layout()
plt.savefig('3d-scatter.png')
plt.show()
|
