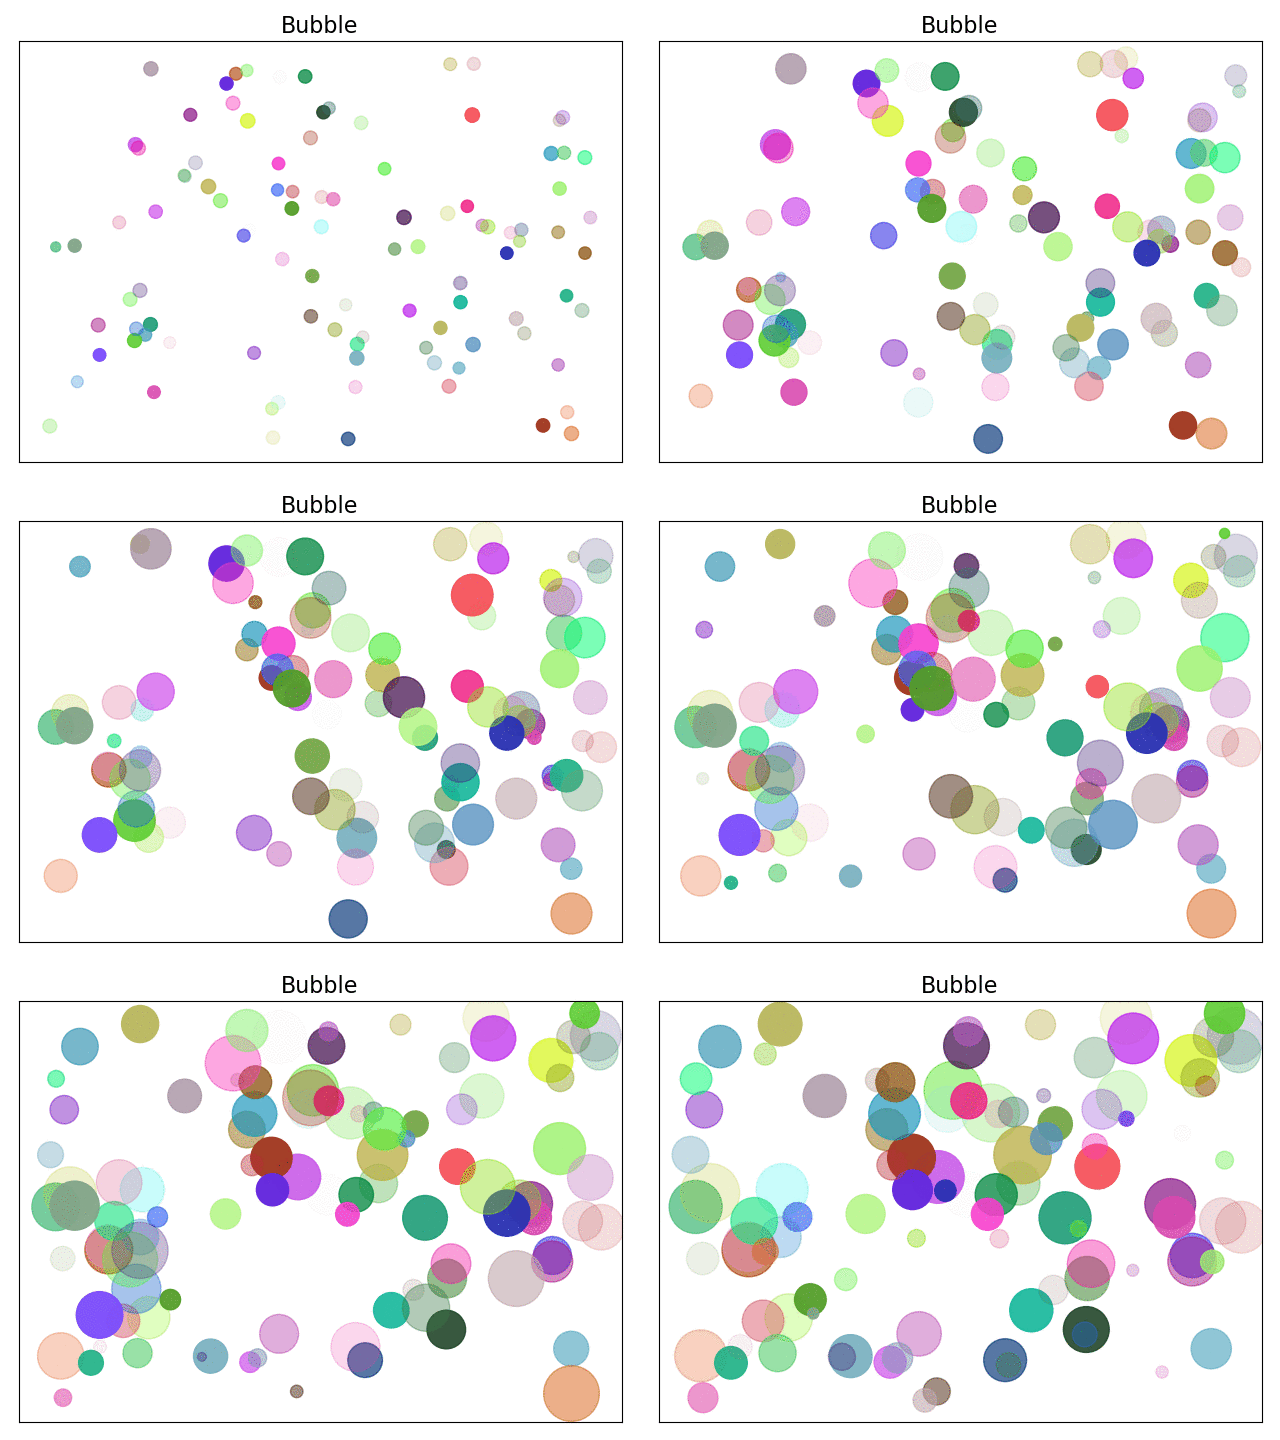
1
2
3
4
5
6
7
8
9
10
11
12
13
14
15
16
17
18
19
20
21
22
23
24
25
26
27
28
29
30
31
32
33
34
35
36
37
38
39
40
41
42
43
44
45
| import numpy as np
import matplotlib.pyplot as plt
import matplotlib.animation as ma
n = 100
balls = np.zeros(n, dtype=[
('position', float, 2),
('size', float, 1),
('growth', float, 1),
('color', float, 4)])
balls['position'] = np.random.uniform(0, 1, (n, 2))
balls['size'] = np.random.uniform(40, 50, n)
balls['growth'] = np.random.uniform(10, 20, n)
balls['color'] = np.random.uniform(0, 1, (n, 4))
plt.figure('Bubble', facecolor='lightgray')
plt.title('Bubble', fontsize=16)
sc = plt.scatter(balls['position'][:, 0], balls['position'][:, 1], balls['size'], color=balls['color'])
plt.xticks([])
plt.yticks([])
def update(number):
balls['size'] += balls['growth']
sc.set_sizes(balls['size'])
index = number % n
balls['size'][index] = \
np.random.uniform(40, 70, 1)
balls['position'][index] = \
np.random.uniform(0, 1, (1, 2))
sc.set_sizes(balls['size'])
sc.set_offsets(balls['position'])
anim = ma.FuncAnimation(
plt.gcf(), update, interval=30, save_count=50)
anim.save('bubble_animation.gif',fps=500, writer='imagemagick')
plt.show()
|
