1
2
3
4
5
6
7
8
9
10
11
12
13
14
15
16
17
18
19
20
21
22
23
24
25
26
27
28
29
30
31
32
33
34
35
36
37
38
39
40
41
| import numpy as np
import matplotlib.pyplot as plt
import matplotlib.animation as ma
plt.figure("Signal", facecolor='lightgray')
plt.title("Signal", fontsize=14)
plt.xlim(0, 10)
plt.ylim(-3, 3)
plt.grid(linestyle='--', color='lightgray', alpha=0.5)
pl = plt.plot([], [], color='dodgerblue', label='Signal')[0]
pl.set_data([],[])
x = 0
def y_generator():
global x
while True:
y = np.sin(2 * np.pi * x) * np.exp(np.sin(0.2 * np.pi * x))
yield (x, y)
x += 0.05
data = y_generator()
t, v = [], []
def update(i):
print(i)
global data
x, y = next(data)
t.append(x)
v.append(y)
pl.set_data(t, v)
if(t[-1]>10):
plt.xlim(t[-1]-10, t[-1])
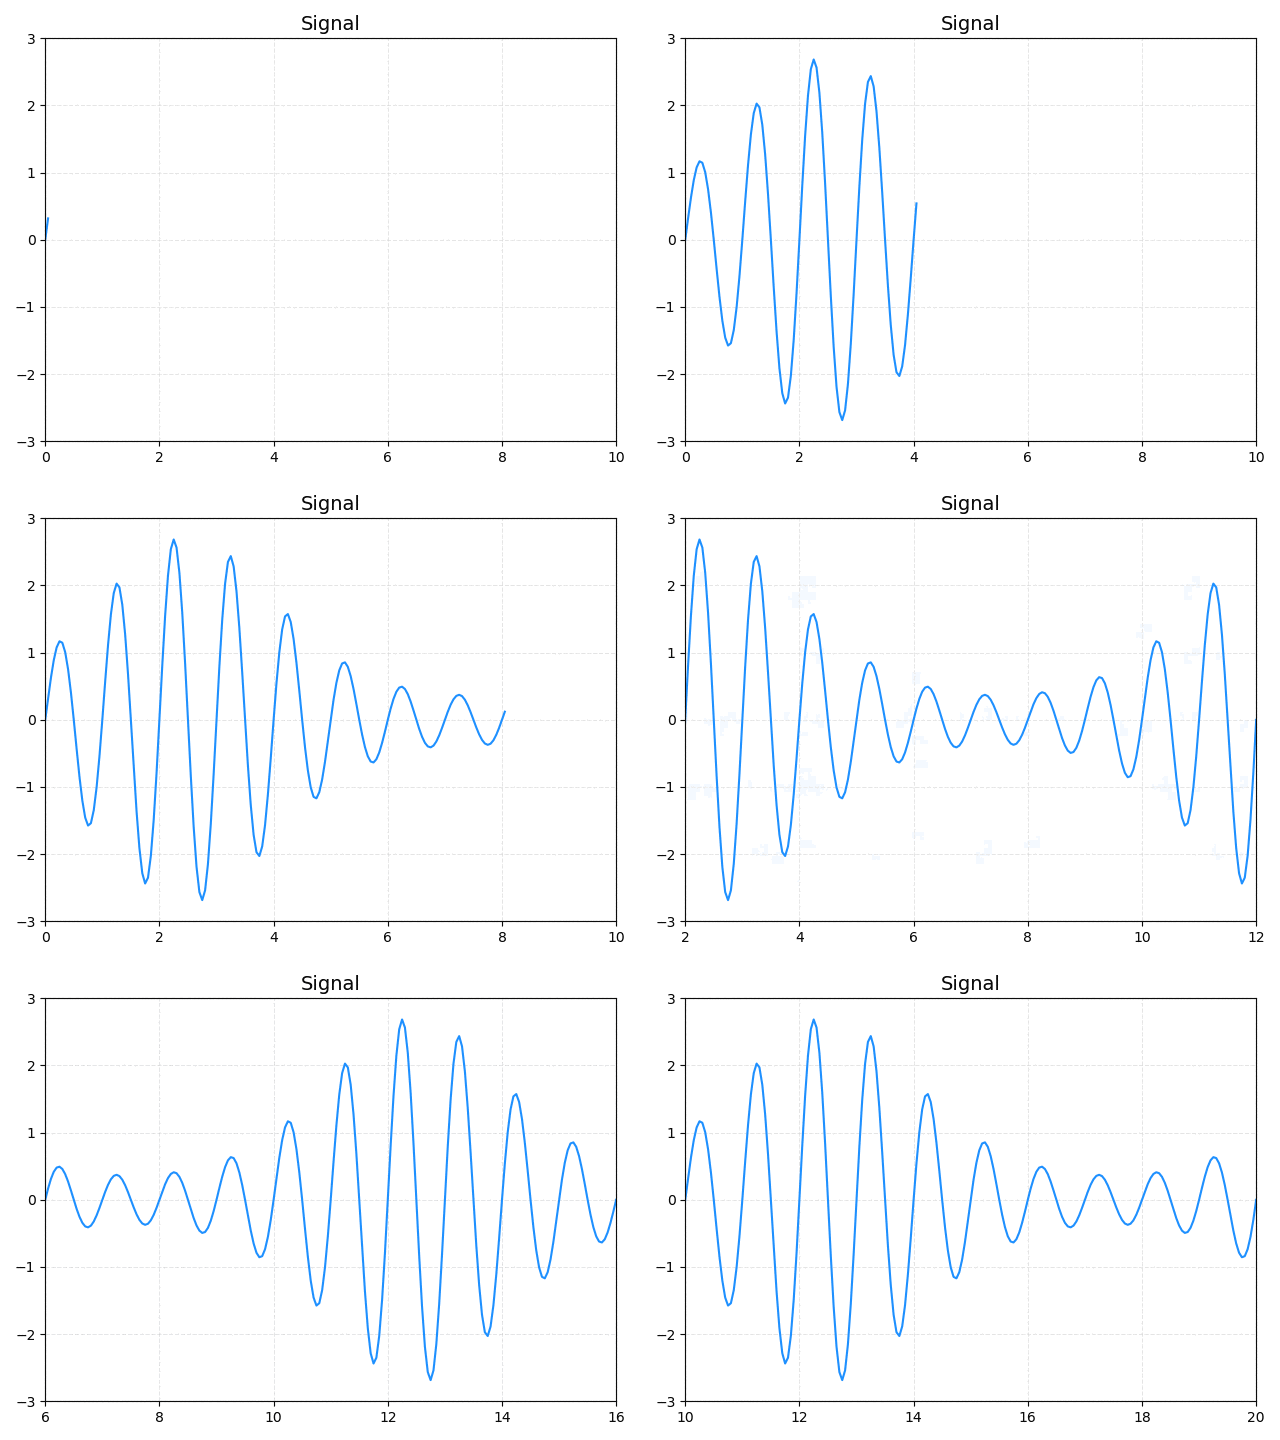
anim = ma.FuncAnimation(plt.gcf(), update, frames=400, interval=40)
plt.tight_layout()
anim.save('Signal_animation.gif', fps=75,writer='imagemagick')
plt.show()
|
