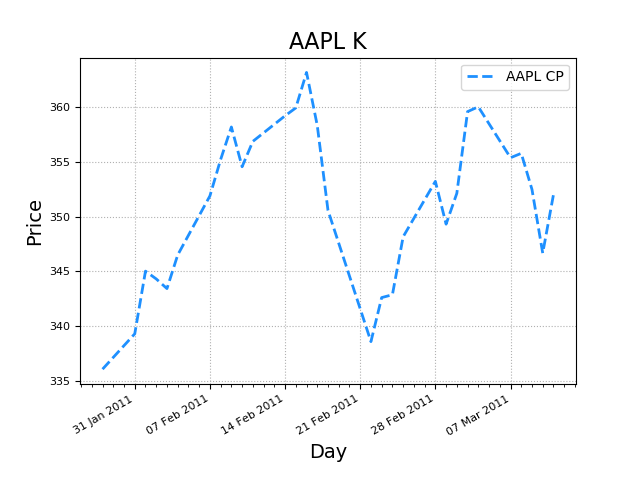
1
2
3
4
5
6
7
8
9
10
11
12
13
14
15
16
17
18
19
20
21
22
23
24
25
26
27
28
29
30
31
32
33
34
35
36
37
38
39
40
41
42
43
44
45
46
47
48
49
50
51
52
| """
demo12_loadtxt.py aapl.csv文件读取
"""
import numpy as np
import datetime as dt
import matplotlib.pyplot as plt
import matplotlib.dates as md
def dmy2ymd(dmy):
dmy = str(dmy, encoding='utf-8')
time = dt.datetime.strptime(dmy, '%d-%m-%Y').date()
t = time.strftime('%Y-%m-%d')
return t
dates, opening_prices, highest_prices,\
lowest_prices, closing_prices = np.loadtxt(
'../data/aapl.csv', delimiter=',',
usecols=(1, 3, 4, 5, 6), unpack=True,
dtype='M8[D], f8, f8, f8, f8',
converters={1: dmy2ymd}
)
plt.figure('AAPL K', facecolor='lightgray')
plt.title('AAPL K', fontsize=16)
plt.xlabel('Day', fontsize=14)
plt.ylabel('Price', fontsize=14)
plt.tick_params(labelsize=10)
plt.grid(linestyle=':')
dates = dates.astype(md.datetime.datetime)
ax = plt.gca()
ax.xaxis.set_major_locator(md.WeekdayLocator(byweekday=md.MO))
ax.xaxis.set_major_formatter(md.DateFormatter('%d %b %Y'))
ax.xaxis.set_minor_locator(md.DayLocator())
plt.tick_params(labelsize=8)
plt.plot(dates, closing_prices,
color='dodgerblue', linewidth=2,
linestyle='--', label='AAPL CP')
plt.legend()
plt.gcf().autofmt_xdate()
plt.savefig('Apple_stock_prices_with_dates.png')
plt.show()
|
