1
2
3
4
5
6
7
8
9
10
11
12
13
14
15
16
17
18
19
20
21
22
23
24
25
26
27
28
29
30
31
32
33
34
35
36
37
38
39
40
41
42
43
44
45
46
47
48
49
50
51
52
53
54
55
56
57
58
59
60
61
62
63
64
65
66
67
68
69
70
71
72
73
74
75
76
77
78
79
80
81
82
83
84
85
86
87
88
89
90
91
92
93
94
95
96
97
98
99
100
101
102
103
104
105
106
107
| """
demo01_lr.py linear regression
"""
import numpy as np
import matplotlib.pyplot as plt
import matplotlib.pyplot as mp
from mpl_toolkits.mplot3d import axes3d
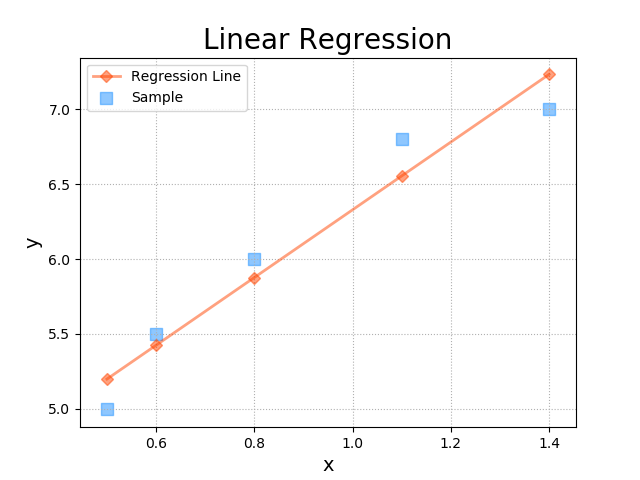
train_x = np.array([0.5, 0.6, 0.8, 1.1, 1.4])
train_y = np.array([5.0, 5.5, 6.0, 6.8, 7.0])
test_x = np.array([0.45, 0.55, 1.0, 1.3, 1.5])
test_y = np.array([4.8, 5.3, 6.4, 6.9, 7.3])
times = 1000
lrate = 0.01
epoches = []
w0, w1, losses = [1], [1], []
for i in range(1, times + 1):
epoches.append(i)
loss = (((w0[-1] + w1[-1] * train_x) - train_y) ** 2).sum() / 2
losses.append(loss)
d0 = ((w0[-1] + w1[-1] * train_x) - train_y).sum()
d1 = (((w0[-1] + w1[-1] * train_x) - train_y) * train_x).sum()
w0.append(w0[-1] - lrate * d0)
w1.append(w1[-1] - lrate * d1)
pred_y = w0[-1] + w1[-1] * train_x
plt.figure('Linear Regression', facecolor='lightgray')
plt.title('Linear Regression', fontsize=20)
plt.xlabel('x', fontsize=14)
plt.ylabel('y', fontsize=14)
plt.tick_params(labelsize=10)
plt.grid(linestyle=':')
plt.scatter(train_x, train_y, marker='s', c='dodgerblue', alpha=0.5, s=80, label='Sample')
plt.plot(train_x, pred_y, marker='D', c='orangered', alpha=0.5, label='Regression Line', linewidth=2)
plt.legend()
plt.savefig('sample-and-prediction')
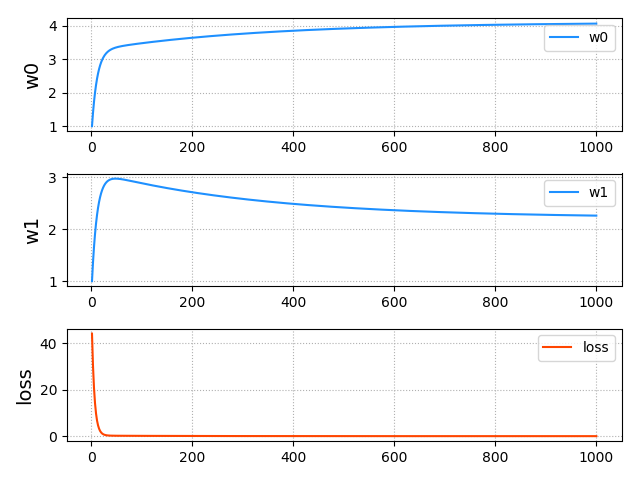
mp.figure('Training Progress', facecolor='lightgray')
mp.title('Training Progress', fontsize=16)
mp.subplot(311)
mp.ylabel('w0', fontsize=14)
mp.grid(linestyle=':')
mp.plot(epoches, w0[:-1], color='dodgerblue',
label='w0')
mp.legend()
mp.subplot(312)
mp.ylabel('w1', fontsize=14)
mp.grid(linestyle=':')
mp.plot(epoches, w1[:-1], color='dodgerblue',
label='w1')
mp.legend()
mp.subplot(313)
mp.ylabel('loss', fontsize=14)
mp.grid(linestyle=':')
mp.plot(epoches, losses, color='orangered',
label='loss')
mp.legend()
mp.tight_layout()
plt.savefig('weight-and-loss.png')
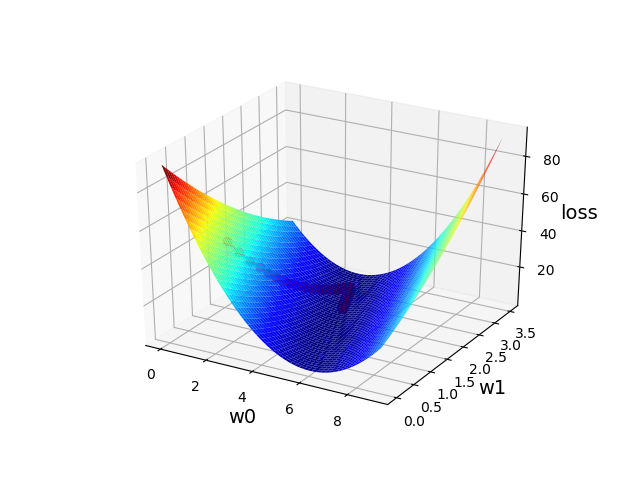
n = 500
w0_grid, w1_grid = np.meshgrid(np.linspace(0, 9, n),
np.linspace(0, 3.5, n))
loss = np.zeros_like(w0_grid)
for x, y in zip(train_x, train_y):
loss += (w0_grid + w1_grid * x - y)**2 / 2
mp.figure('Loss Function', facecolor='lightgray')
ax3d = mp.gca(projection='3d')
ax3d.set_xlabel('w0', fontsize=14)
ax3d.set_ylabel('w1', fontsize=14)
ax3d.set_zlabel('loss', fontsize=14)
ax3d.plot_surface(w0_grid, w1_grid, loss, cmap='jet')
ax3d.plot(w0[:-1], w1[:-1], losses, 'o-',
color='red')
plt.savefig('gradient3D.png')
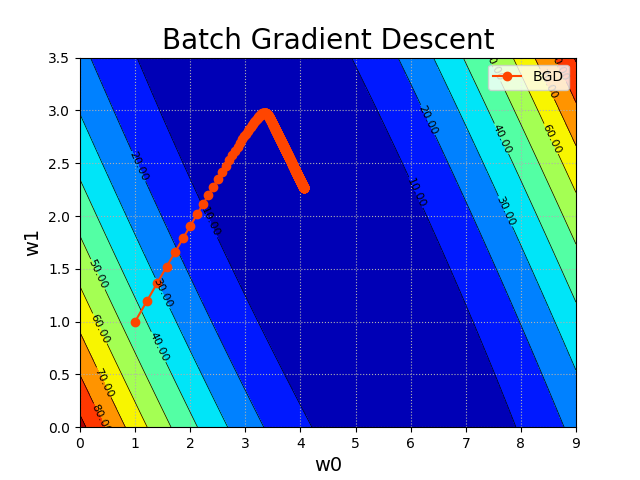
mp.figure('Batch Gradient Descent', facecolor='lightgray')
mp.title('Batch Gradient Descent', fontsize=20)
mp.xlabel('w0', fontsize=14)
mp.ylabel('w1', fontsize=14)
mp.tick_params(labelsize=10)
mp.grid(linestyle=':')
mp.contourf(w0_grid, w1_grid, loss, 10, cmap='jet')
cntr = mp.contour(w0_grid, w1_grid, loss, 10,
colors='black', linewidths=0.5)
mp.clabel(cntr, inline_spacing=0.1, fmt='%.2f',
fontsize=8)
mp.plot(w0, w1, 'o-', c='orangered', label='BGD')
mp.legend()
plt.savefig('gradient-contour.png')
plt.show()
|


