1
2
3
4
5
6
7
8
9
10
11
12
13
14
15
16
17
18
19
20
21
22
23
24
25
26
27
28
29
30
31
32
33
34
35
| """
demo sklearn.linear_model
"""
import numpy as np
import matplotlib.pyplot as plt
import sklearn.linear_model as lm
x, y = np.loadtxt(
'../ml_data/single.txt', delimiter=',',
usecols=(0, 1), unpack=True)
model = lm.LinearRegression()
x = x.reshape(-1, 1)
model.fit(x, y)
pred_y = model.predict(x)
import sklearn.metrics as sm
print(sm.mean_absolute_error(pred_y, y))
print(sm.mean_squared_error(pred_y, y))
print(sm.median_absolute_error(pred_y, y))
print(sm.r2_score(pred_y, y))
plt.figure('Linear Regression', facecolor='lightgray')
plt.title('Linear Regression', fontsize=16)
plt.xlabel('x')
plt.ylabel('y')
plt.tick_params(labelsize=10)
plt.grid(linestyle=':')
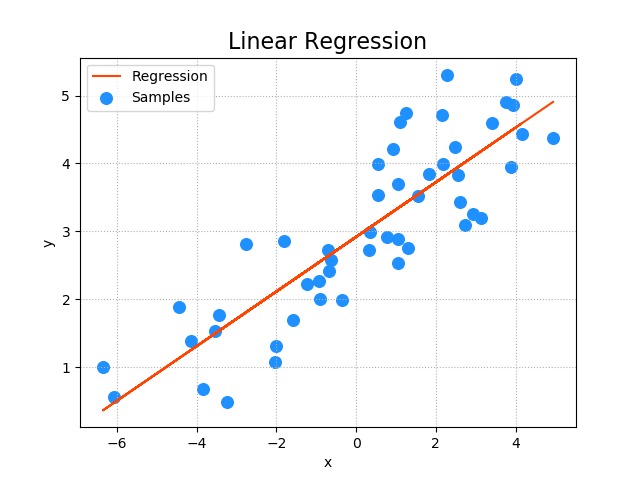
plt.scatter(x, y, color='dodgerblue', label='Samples', s=70, marker='o')
plt.plot(x, pred_y, c='orangered', label='Regression')
plt.legend()
plt.savefig('sklearn-linear-regression.png')
plt.show()
|
